
Related
Jun 18,2026
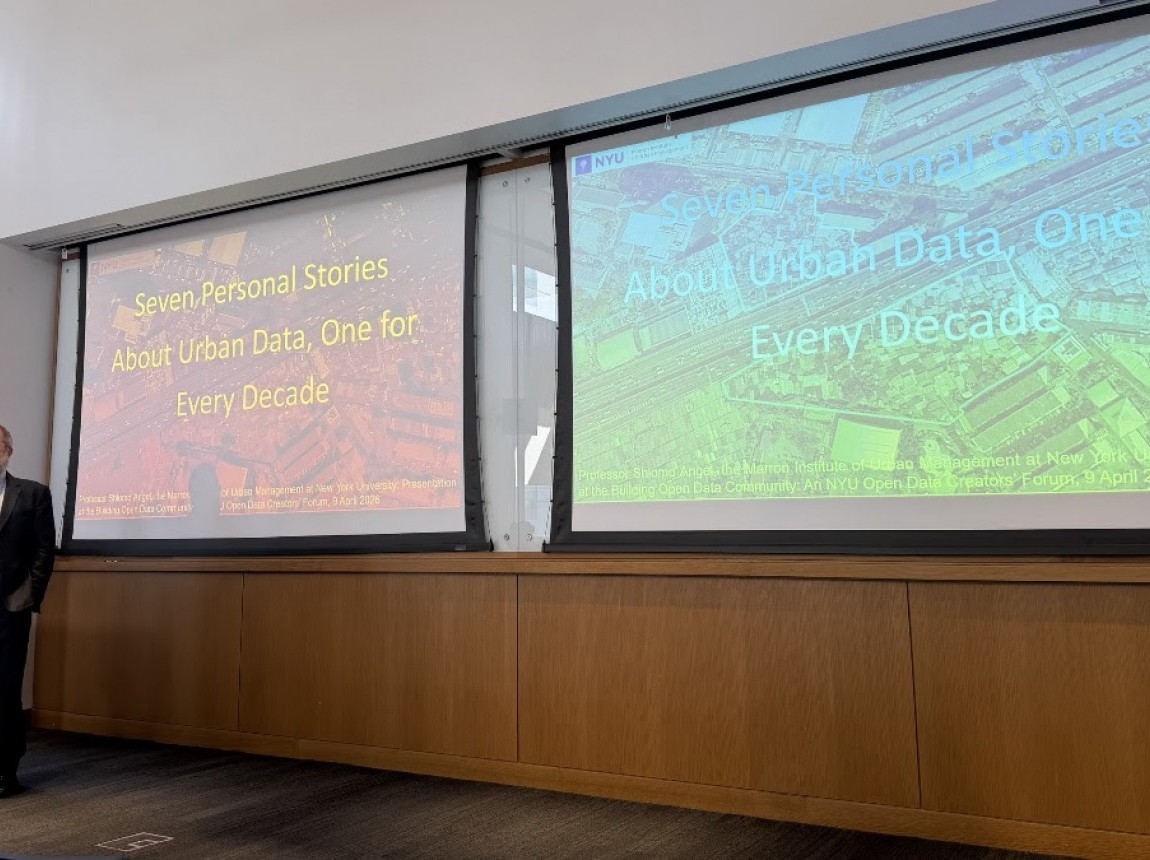
Marron Co-Hosts Urban Data Community Forum
Jun 18,2026
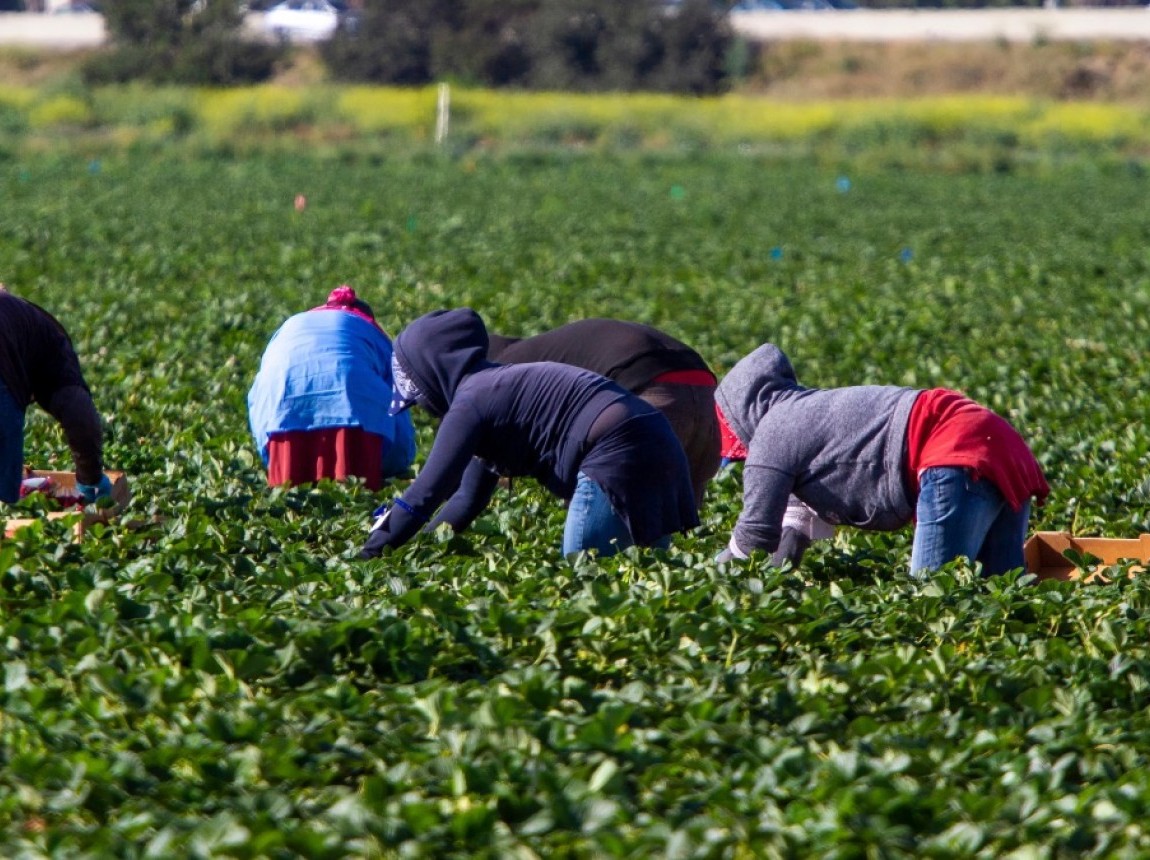
Meredith Dank Releases Labor Trafficking Study
Jun 18,2026
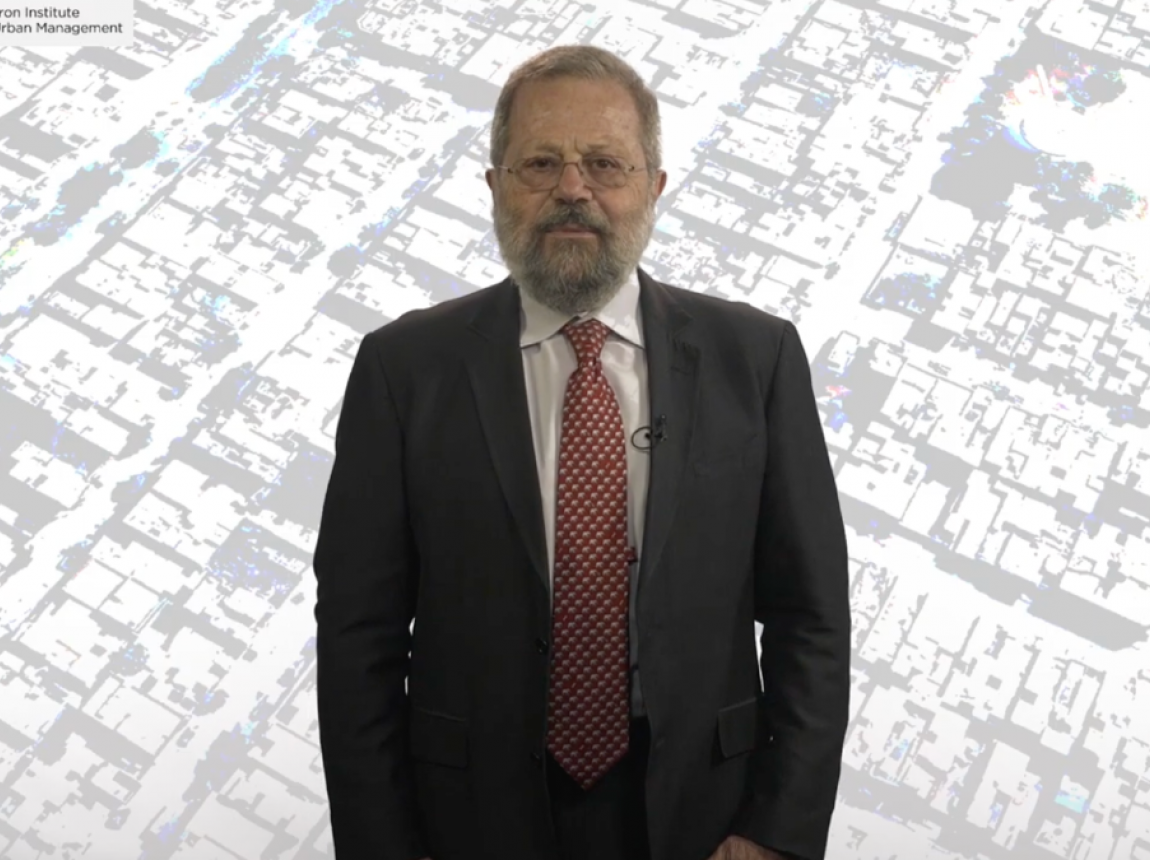
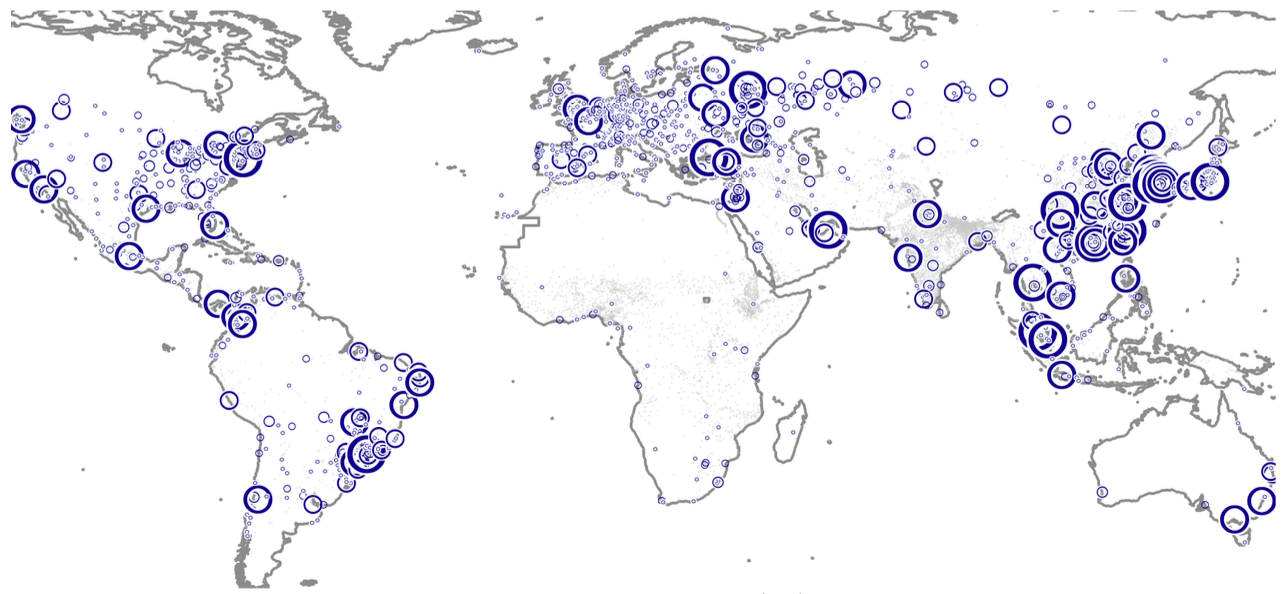
Solly Angel Releases
Recorded Urban Expansion Lectures
Jun 18,2026
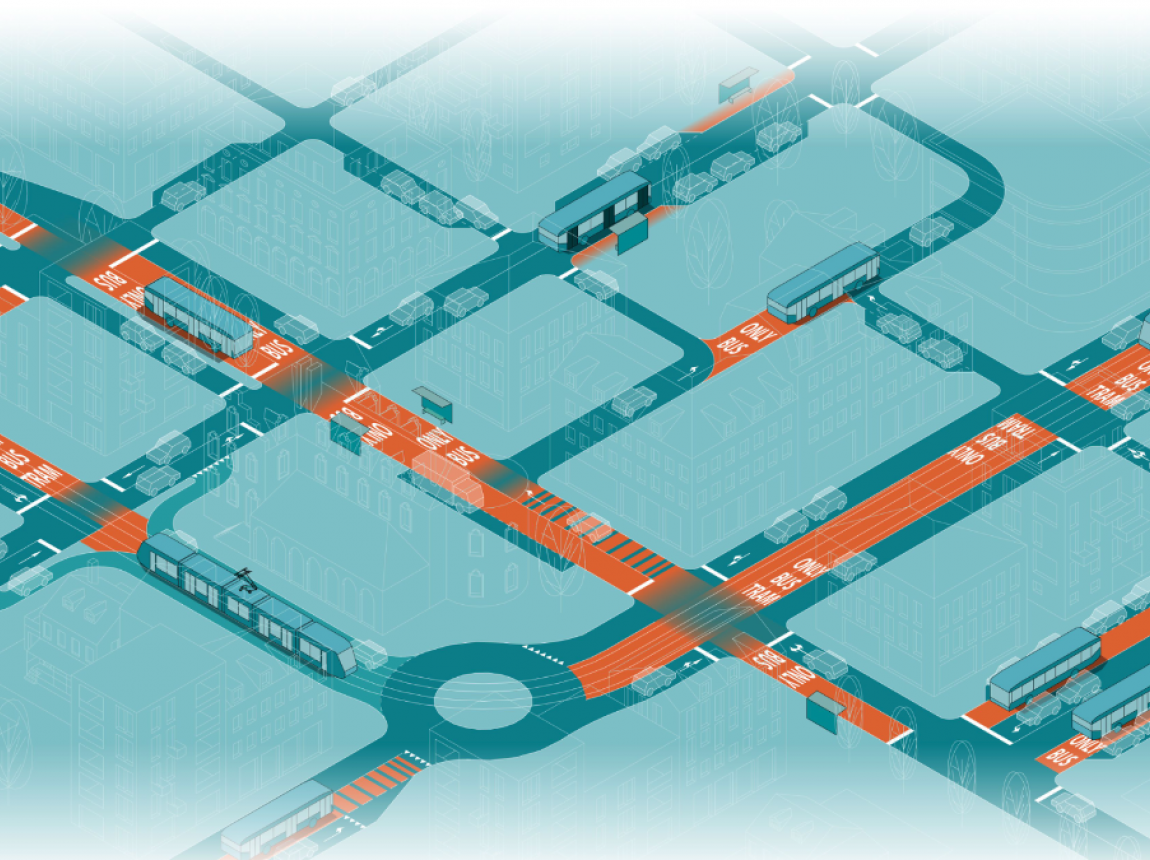
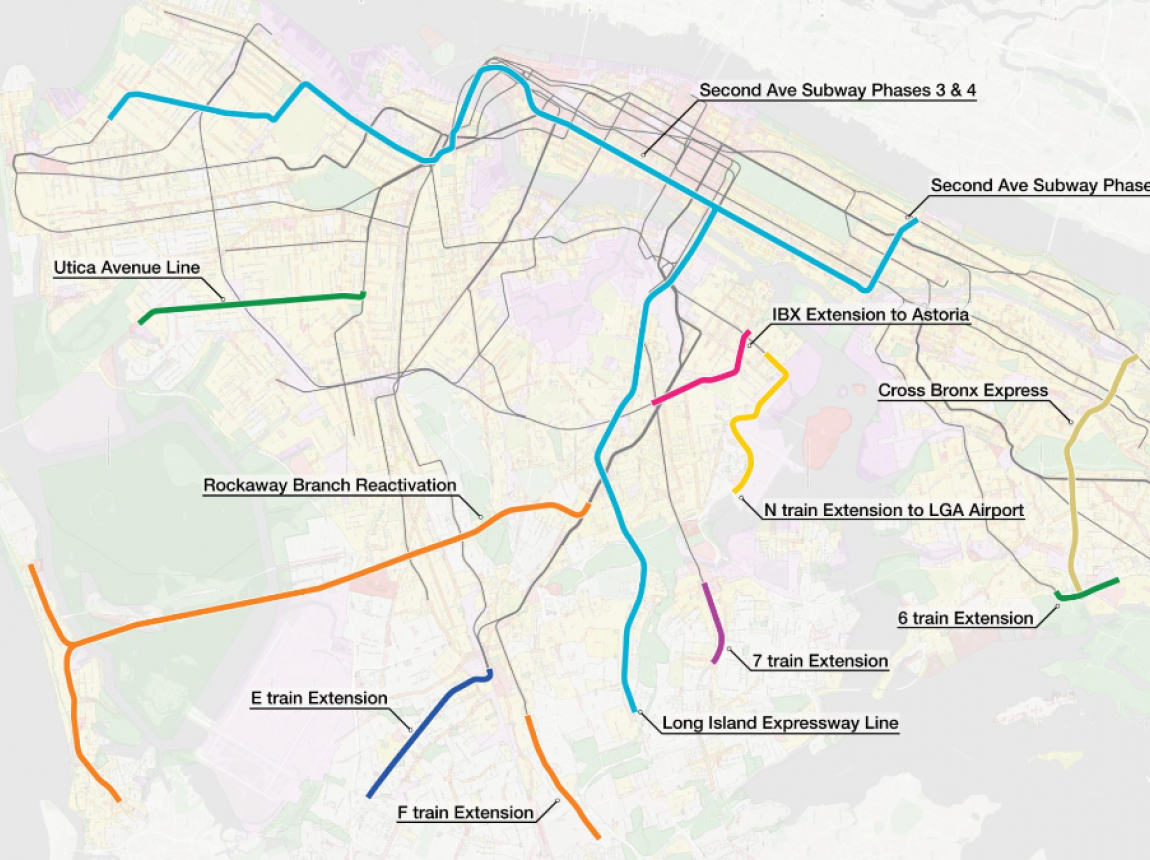
Transportation and Land Use Program
Releases Transit Priority Atlas

Jun 18,2026
Kevin Cromar Raises Technical Concerns
with EPA’s Section 179B Ozone Decision

Jun 18,2026
Constantine Kontokosta Receives Funding
from the Real Estate Research Institute
Jun 18,2026
Marron Researchers Publish
on Post-Pandemic Commuting Patterns in Nature Cities

Jun 18,2026
Newsletter 6.18.26
Press
/ Mar 19,2026
The ‘Starfish’ City:
How Melbourne’s Shape Is Pushing Young Workers Out
Press
/ Mar 19,2026
Saudi Arabia Didn’t Learn Anything
From China’s ‘Ghost Cities’
Press
/ Mar 19,2026
TRACCS Calls for National Framework
for Passenger Rail Projects
Press
/ Mar 19,2026
Are Planning Regulations
Making Our Houses Unaffordable?

Mar 19,2026
New Researcher Appointments

Mar 19,2026
Newsletter 3.19.26
Mar 19,2026
Jonathan English’s Transit Programming

Mar 19,2026
Kevin Cromar Participates in Webinar Showcasing
Advances in North American Smoke Forecasting for Health
Mar 19,2026
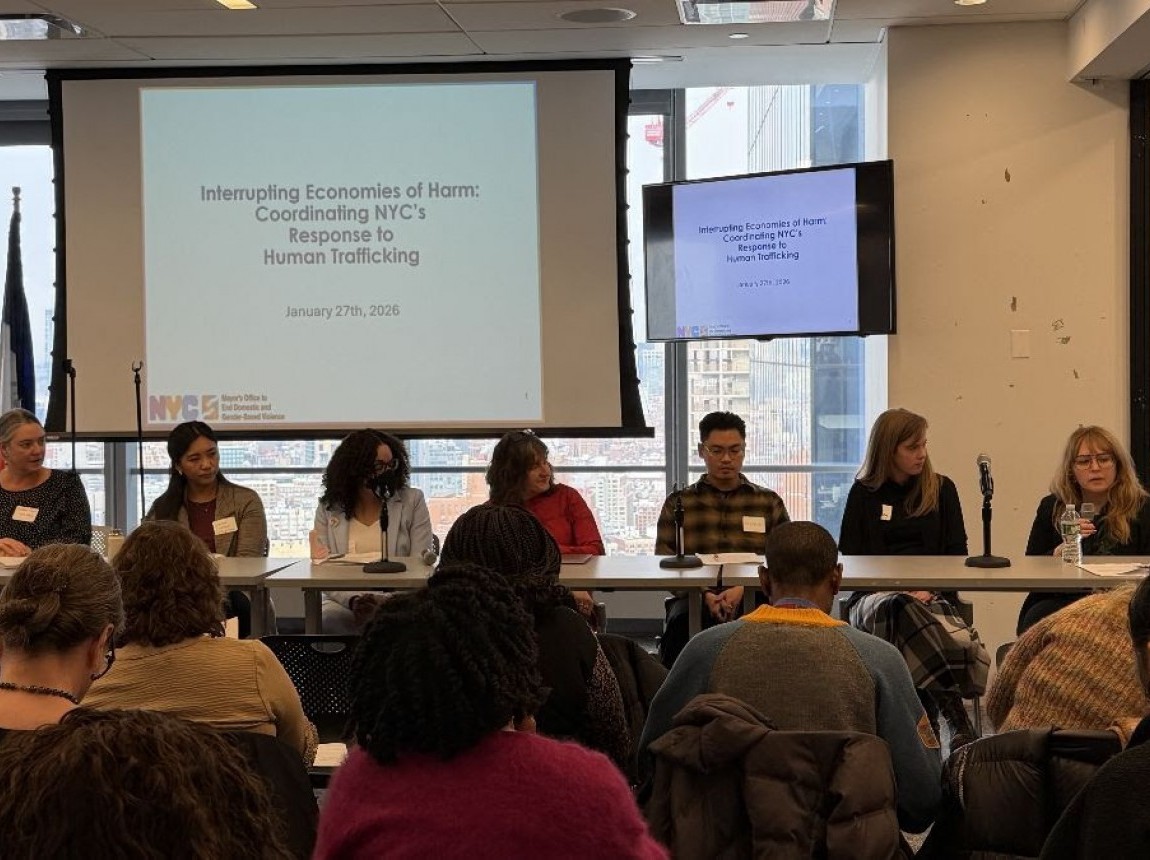
Meredith Dank Serves as Panelist
for NYC’s Response to Human Trafficking Conference

Mar 19,2026
Local Building Performance Standards:
An Analysis of Progress to Date and Guide for Future Policy

Mar 19,2026
Alain Bertaud Delivers Keynote in Chandigarh
Mar 19,2026
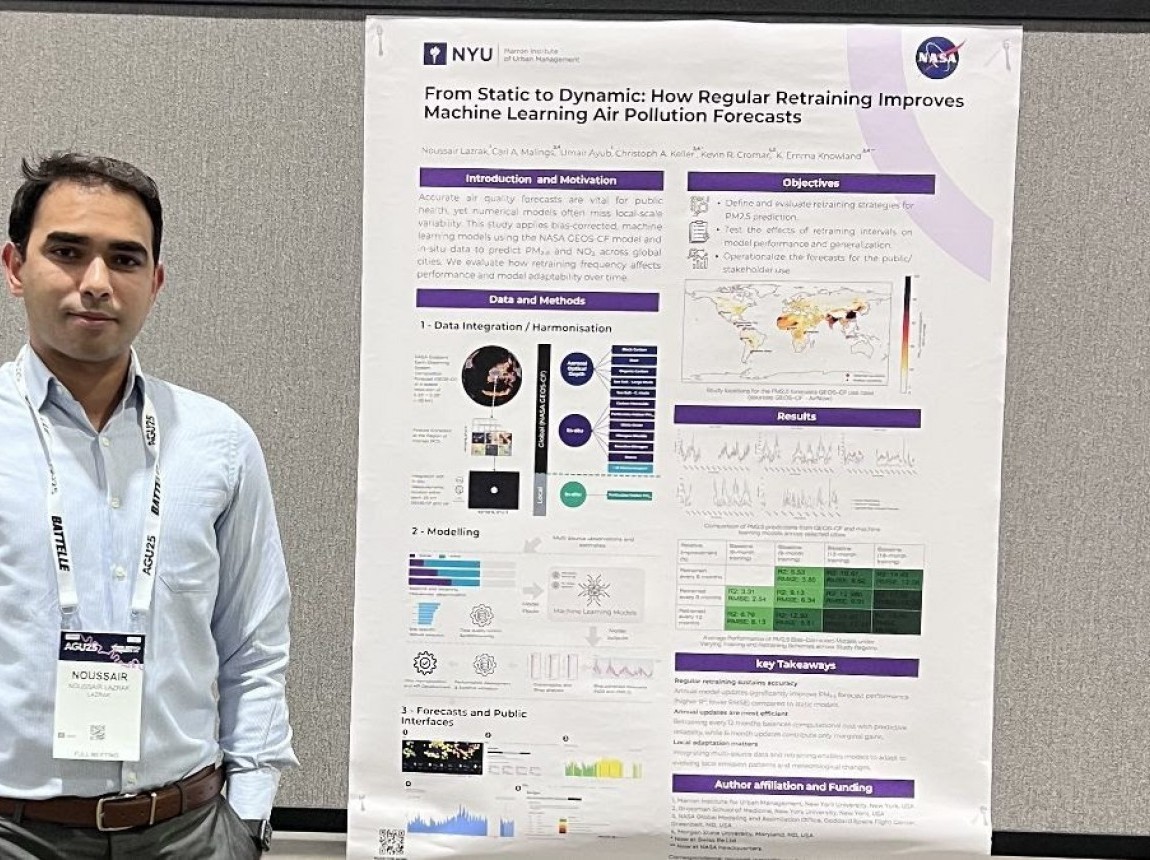
American Geophysical Union Presentation
on Air Quality Forecasting Research

Mar 19,2026
Simon De Boeck on What We Can Learn
from Barcelona’s Superblocks
Mar 19,2026
Event in Recognition
of Human Trafficking Prevention Month

Mar 19,2026
Alain Bertaud Addresses the Role
of Urban Planning in New Zealand

The New York Times
Press
/ Mar 19,2026
Research on Subway Operators
Influences New York Governor
Mar 19,2026
Research on Subway Operators
Influences New York Governor
Mar 19,2026
Marron-Taught Cool Course:
Applied Research to Solve Urban Problem
The New York Times
Press
/ Mar 19,2026
A Better Billion
Mar 19,2026
A Better Billion:
Expanding Transit & Housing for a More Affordable New York
Working Paper
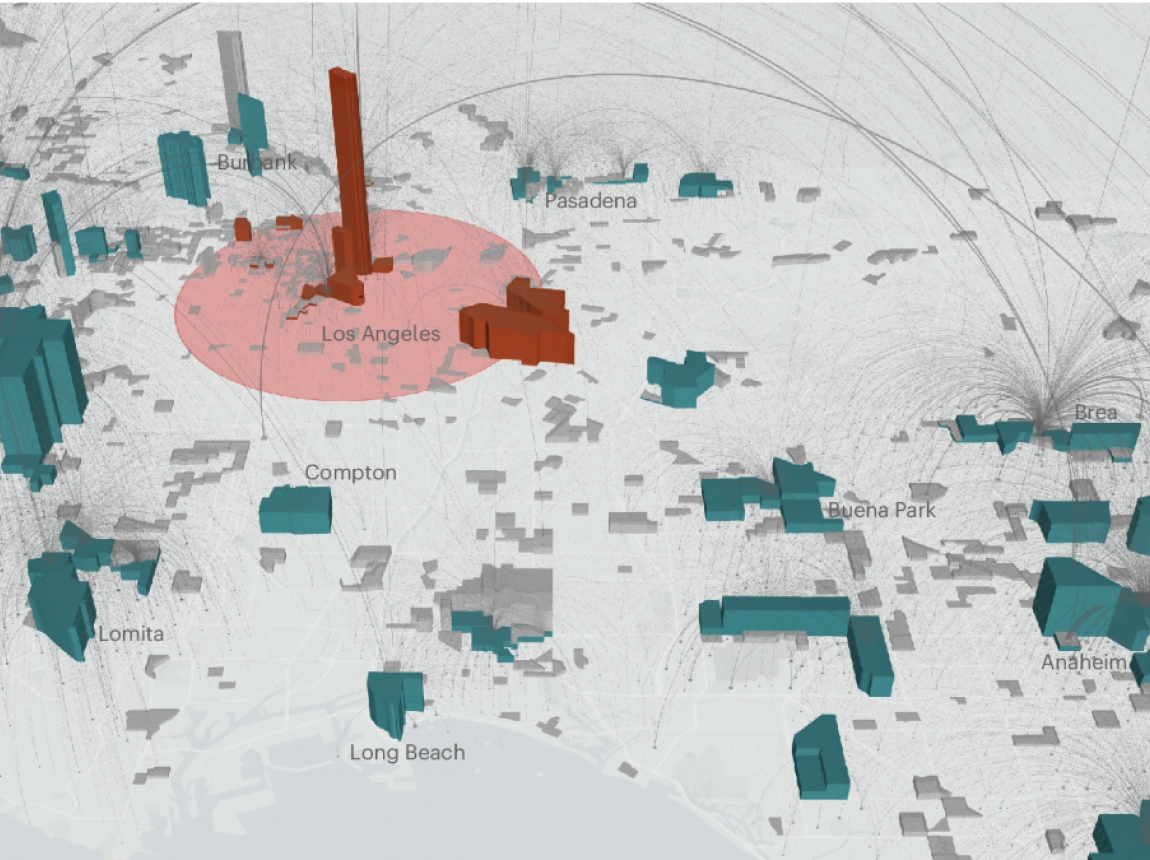
/ Mar 09,2026
The Skyscraper Revolution:
Global Economic Development and Land Savings

Dec 22,2025
NYU Marron Annual Letter 2025
Dec 15,2025
Director's Office Labs Annual Letter 2025
Dec 15,2025
Scale + Lab Annual Letter 2025
Dec 15,2025
Human Exploitation and Resilience Program
Annual Letter 2025
Dec 15,2025
Transportation and Land Use Program
Annual Letter 2025

Dec 15,2025
Civic Analytics Program Annual Letter 2025
Dec 12,2025
Health, Environment, & Policy Program
Annual Letter 2025
Dec 12,2025
Urban Expansion Program Annual Letter 2025

Dec 04,2025
Newsletter 12.04.25

Streetsblog NYC
Press
/ Dec 04,2025
Tuesday’s Headlines: Dean Joins the Team

NPR
Press
/ Dec 04,2025
Should the Bus Be Free?
NYC Looks to Kansas City for Lessons

The New York Daily News
Press
/ Dec 04,2025
Buses Must Have Fares:
Zohran Mamdani's Free Buses Plan Is a No Go

City Journal
Press
/ Dec 04,2025
New Yorkers Don’t Care if Buses Are Free.
New Yorkers Don’t Care if Buses Are Free.
Press
/ Dec 04,2025
A California Dream That Should Come True
Dec 04,2025
Marron Researchers to Serve
on New York City Mayor-Elect Transition Committees

Dec 04,2025
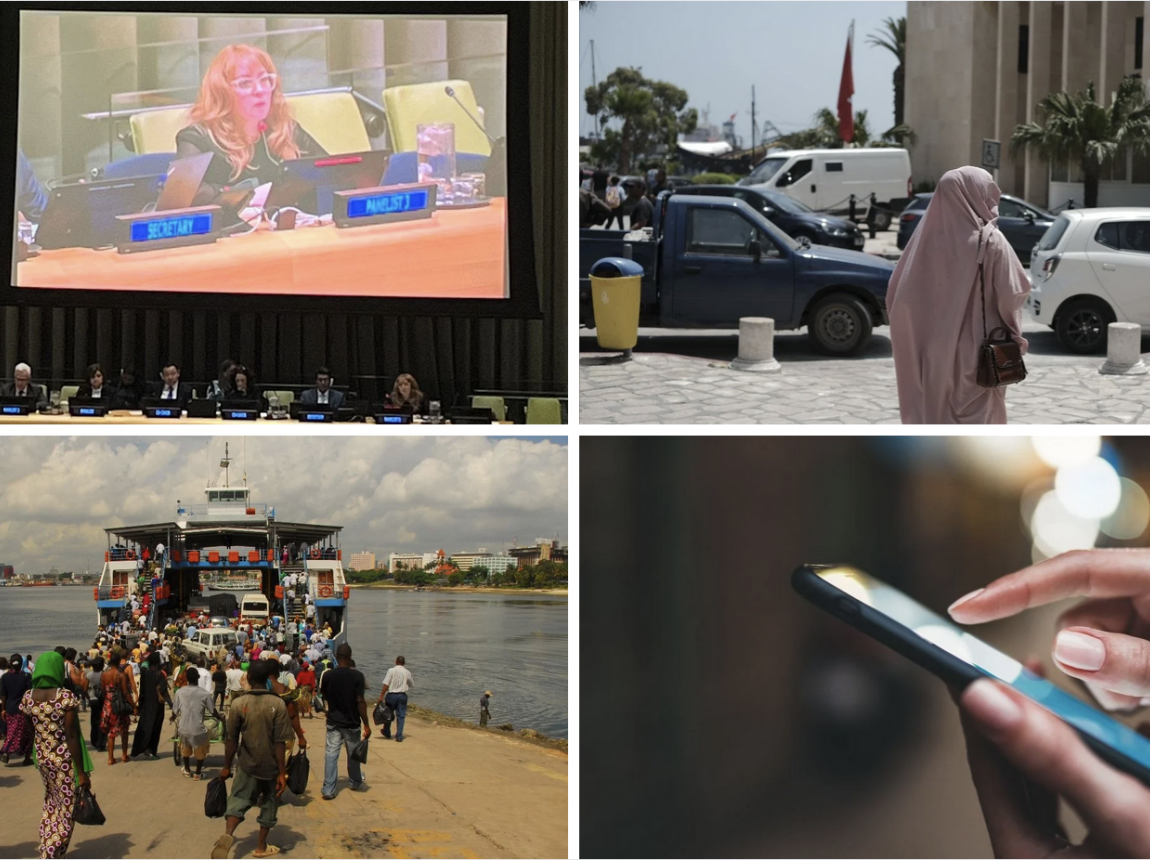
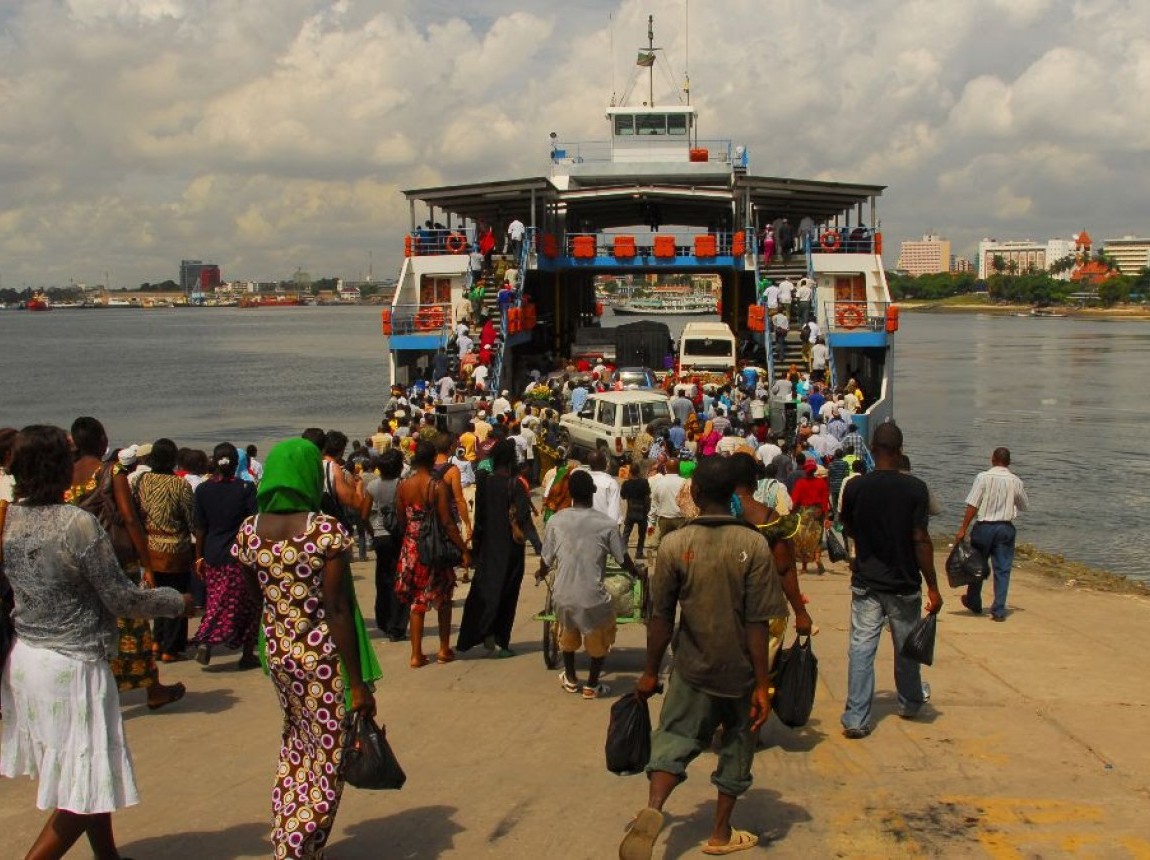
Digital Peer Networks
Empowering Tanzanian Domestic Workers through Online Communities
Dec 04,2025
Elif Ensari Presents
Illegal Parking Incidents Research
Dec 04,2025
Transit Costs Project Questions
Two-Person Crews on NYC Subways

Dec 04,2025
New Directions for AI in Urban Planning
Dec 04,2025
Bartosz Bończak and Elif Ensari
at NYU GIS Day
Dec 04,2025
Constantine Kontokosta Presents Work
on Building Performance Standards
NYU News
Press
/ Dec 04,2025
Bartosz Bończak’s CityWorks Contribution
Profiled in NYU News
Dec 04,2025
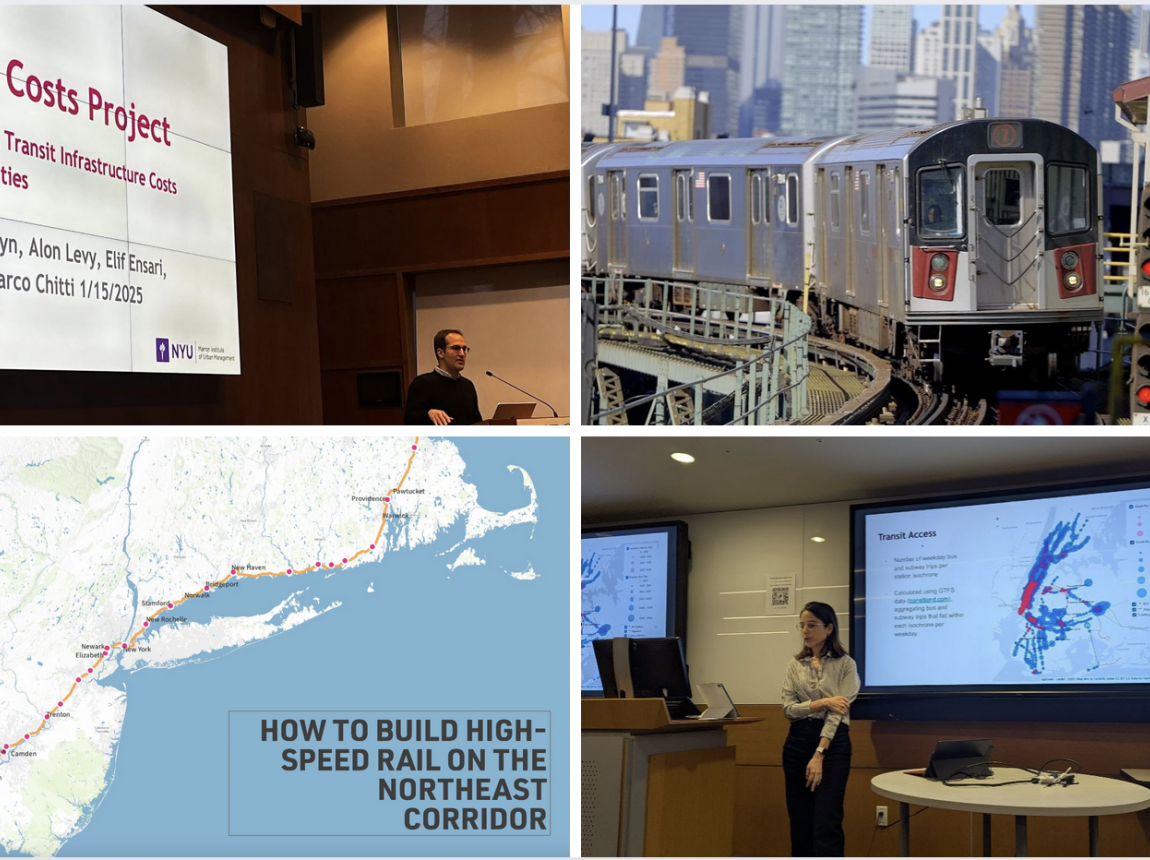
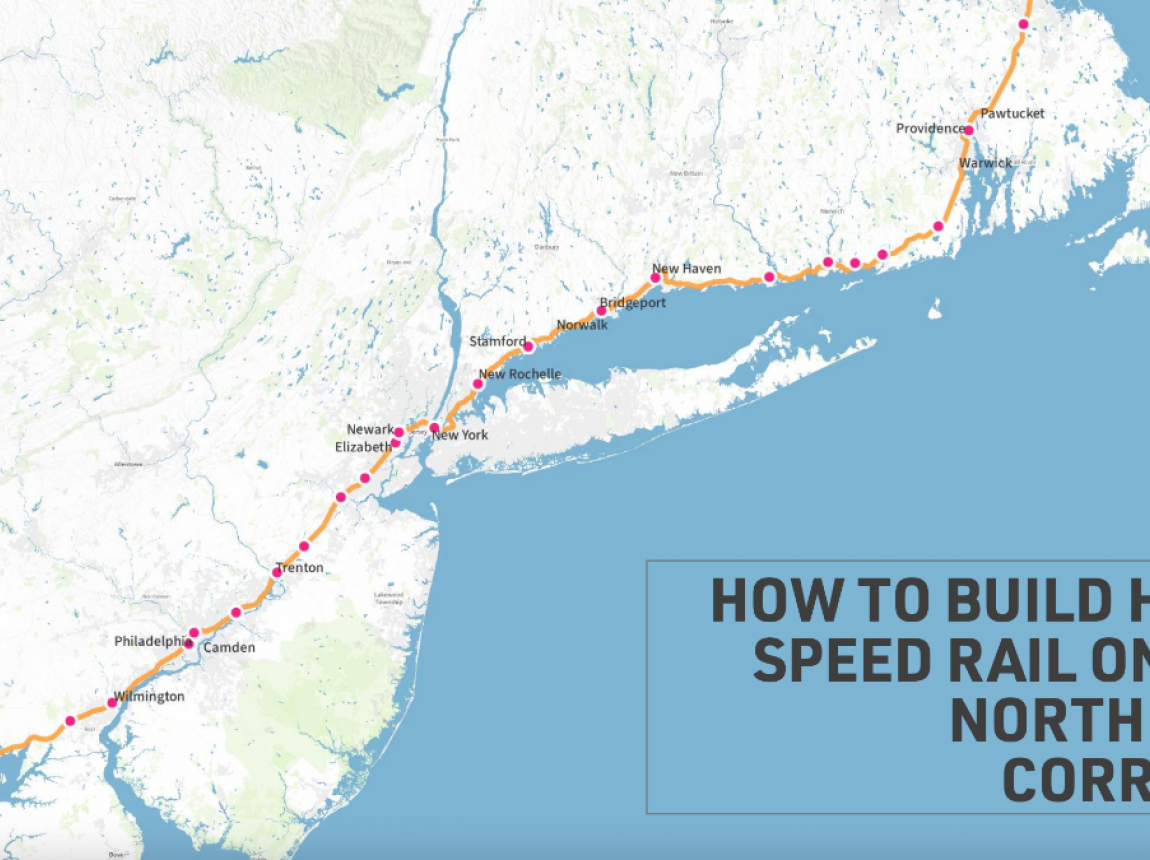
New Northeast Corridor Project Website Available
Dec 04,2025
Meredith Dank Publishes Three Articles
in the Journal of Human Trafficking
The New York Daily News
Press
/ Dec 04,2025
Eric Goldwyn Makes Case for a NYC Transit Mayor
Dec 04,2025
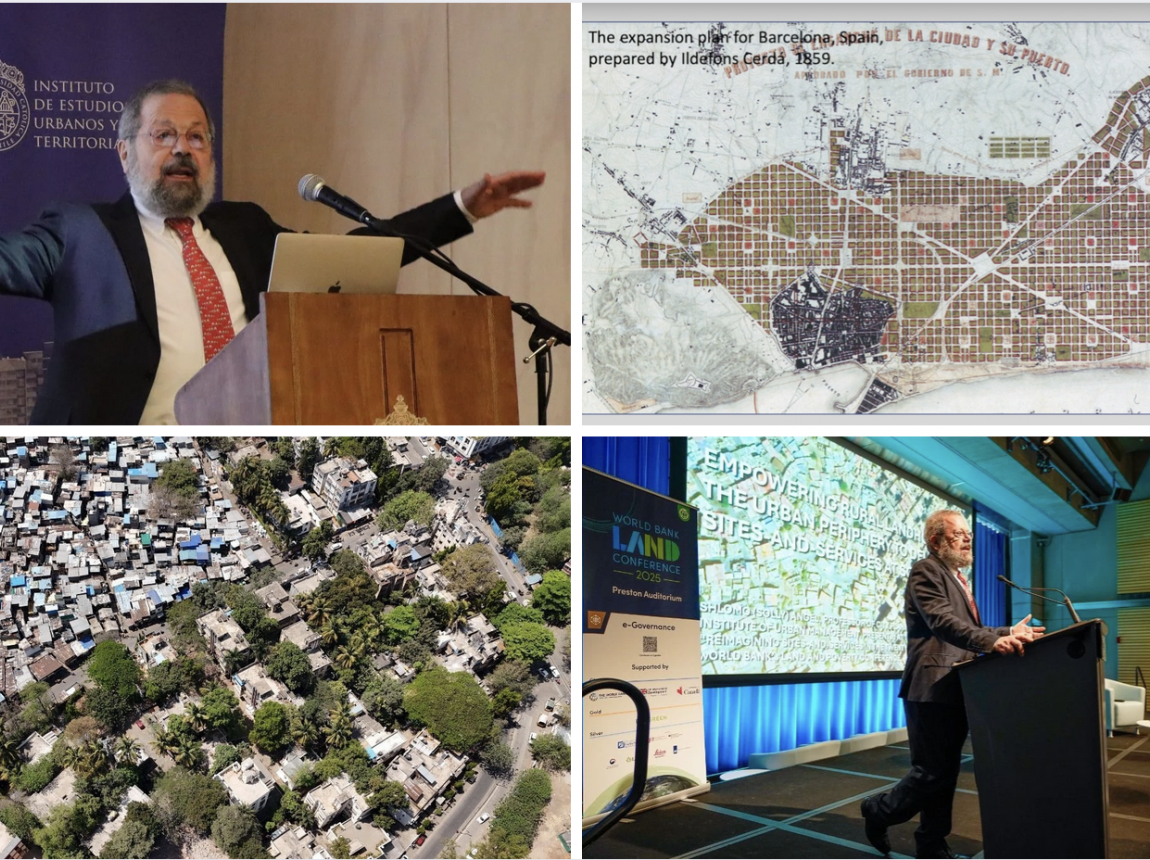
Solly Angel Presents at Global Events
Dec 04,2025
Marron to Provide Expanded Research Opportunities
for NYU Undergraduate Students
Dec 04,2025
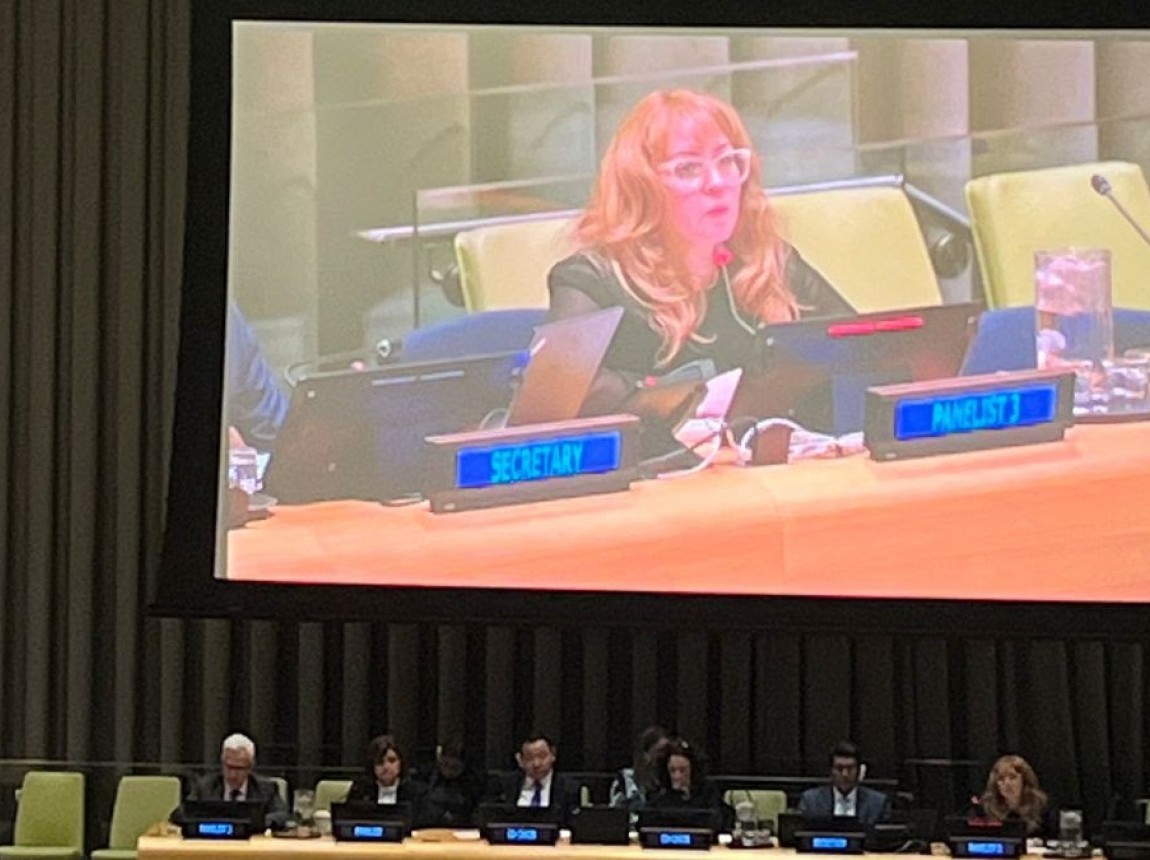
Meredith Dank at the UN General Assembly
to Combat Trafficking in Persons
The New York Times
Press
/ Dec 04,2025
Transit Costs Project Questions
Two-Person Crews on NYC Subways
Dec 04,2025
Civic Analytics Receives Support
from NYC Mayor’s Office and Department of Environmental Protection
Dec 04,2025
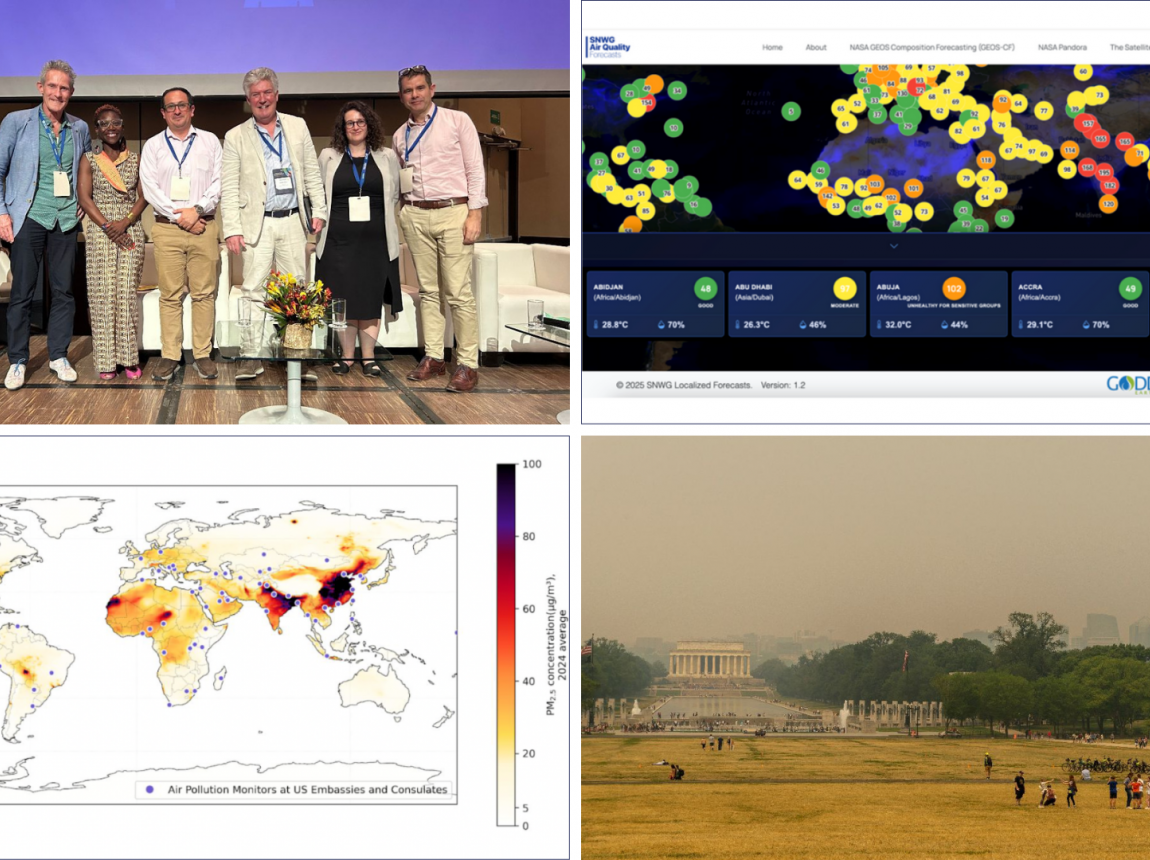
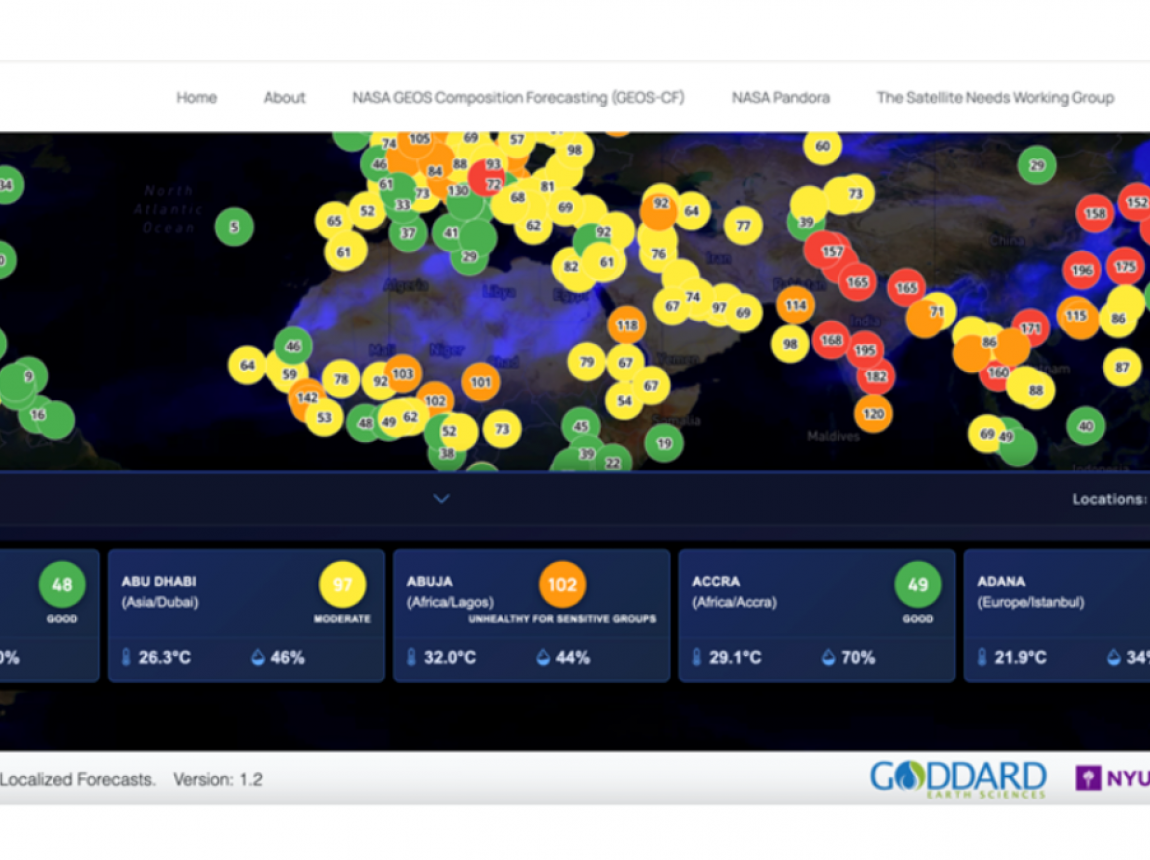
New NASA SNWG Research Funding
to Advance Localized Air Quality Forecasting
Dec 04,2025
The SCALE + Lab
Receives Three-Year Funding

WNYC
Press
/ Oct 30,2025
Eric Goldwyn Debates Free Buses
on The Brian Lehrer Show

Oct 21,2025
Cities and Counties Convene to Discuss
Building Performance Standards Research
Oct 21,2025
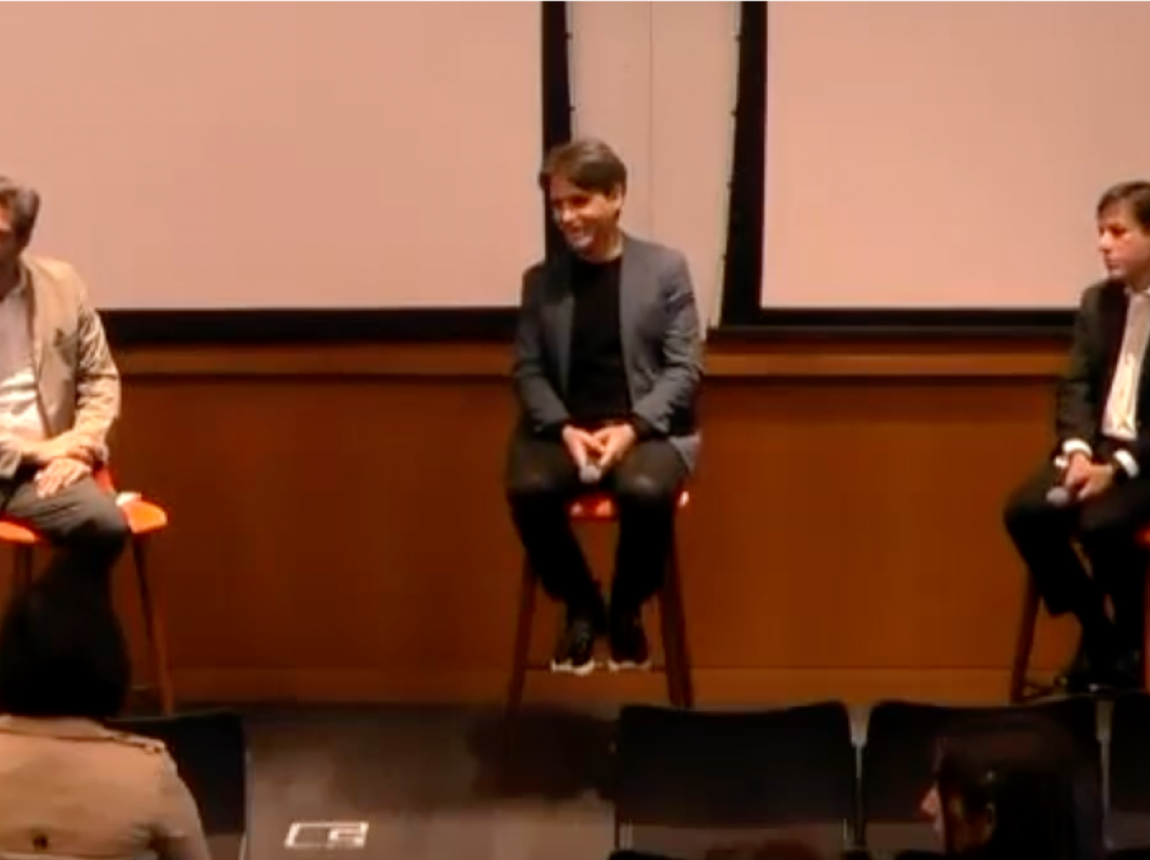
Tim Tompkins Hosts Dan Garodnick and Jorge Almazán
to Discuss Spontaneous Cities
Oct 21,2025
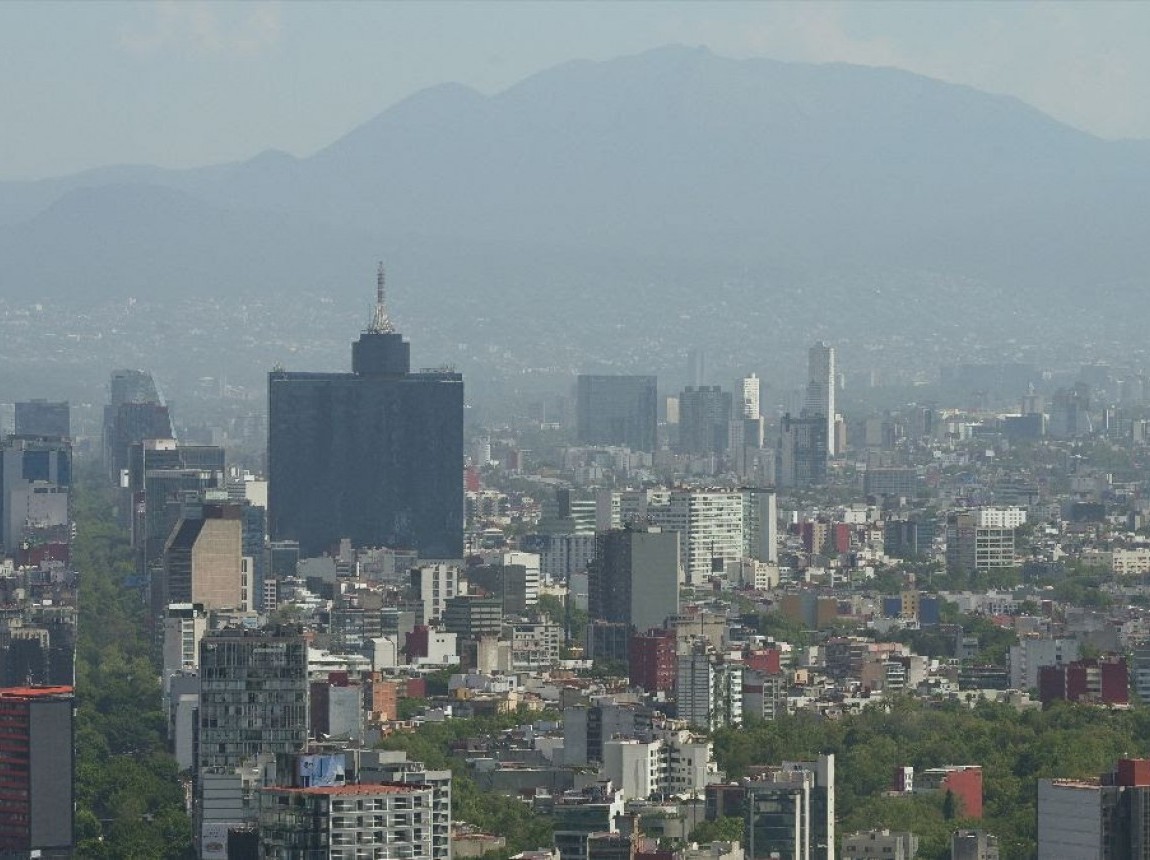
Kevin Cromar Delivers Keynote
on Air Quality Research and Policy in Mexico
Press
/ Oct 21,2025
What U.S. Cities Can Learn from Istanbul
on Building Urban Rail
Oct 21,2025
Meredith Dank Awarded Additional Funding
from U.S. Department of State for Tanzania Project

Oct 21,2025
Newsletter 10.21.25
Streetsblog NYC
Press
/ Oct 21,2025
Let’s Make Muni’s 49 Van Ness/Mission Bus Work
for San Francisco
Press
/ Oct 21,2025
Five Proposals
to Make Government Spending on Transportation More Efficient
The New York Daily News
Press
/ Oct 21,2025
Times Square Casino Would Be a Mistake
NPR
Press
/ Oct 21,2025
Should the Bus Be Free?
Transit Advocates Are Divided
The Economist
Press
/ Oct 21,2025
China’s Urban Planners
Could Determine the Future of City Life
Oct 21,2025
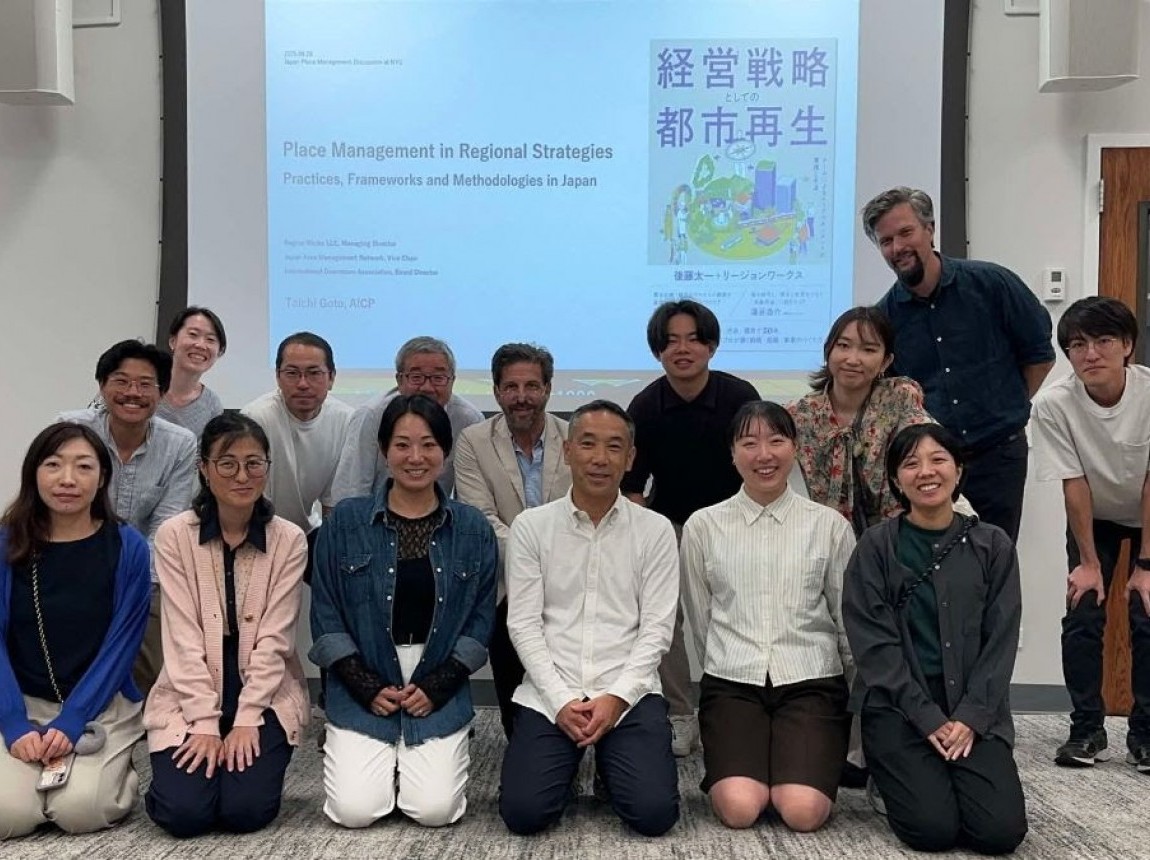
Tim Tompkins Hosts Place Management Convening

Oct 21,2025
Kevin Cromar Provides Testimony
on EPA’s Interim Oil and Gas Rule

Oct 21,2025
Meredith Dank Participates in EUROCRIM 2025
Oct 21,2025