Related

Dec 21,2020
Shlomo Angel, Alejandro M. Blei, Patrick Lamson-Hall, and Maria Monica Salazar Tamayo have written a working paper, "The Coronavirus and the Cities: Explaining Variations in the Onset of Infection and in the Number of Reported Cases and Deaths in U.S. Metropolitan Areas as of 27 March 2020."
Abstract
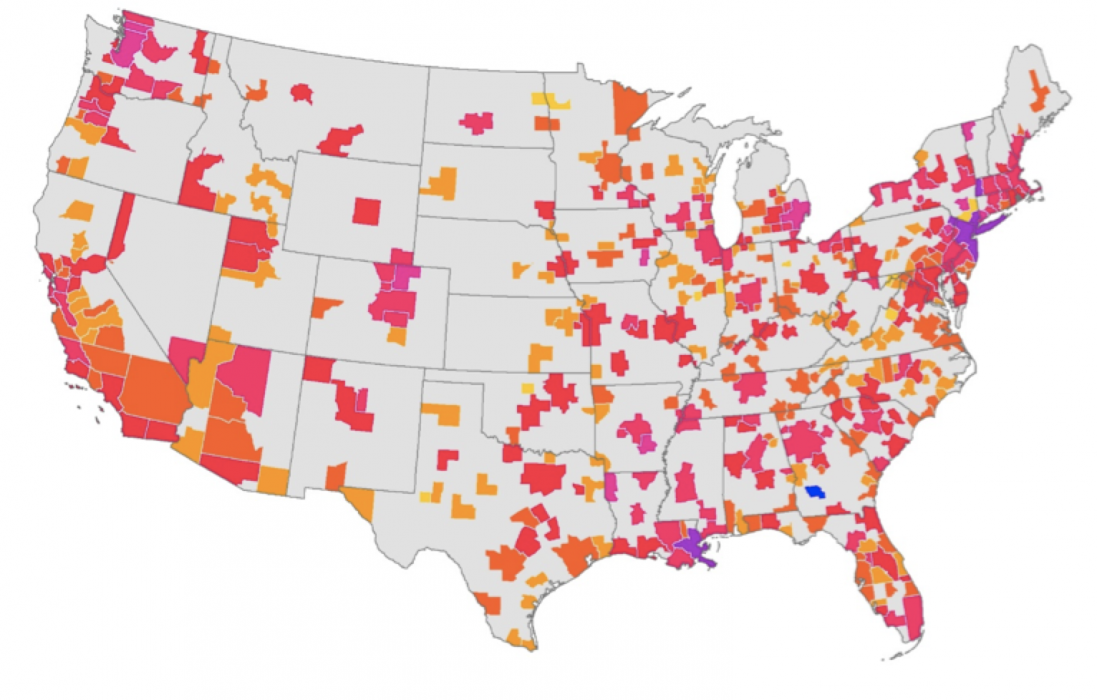
We can now begin to explain the geographic variations in the date of the onset of infections, in the number of confirmed cases, and in the number of deaths from the Coronavirus. Instead of focusing on states or on counties, we focus on cities, and more specifically on Metropolitan Statistical Areas (MSAs) in the United States. Others have already began to look at the spread of the Coronavirus in U.S. cities. The virus does not recognize state or county boundaries and MSAs indeed cross over both county and state boundaries. MSAs are integrated urban economies with a high level of connectivity within them, suggesting that they are the appropriate units for analyzing the data on the spread of the virus.
The question that many of us are asking is ‘why do some U.S. metropolitan areas have more infections and more deaths than others?’ A number of conjectures have been advanced. The governor of the state of New York, Andrew Cuomo, for example, conjectured on 26 March that New York has more cases than any other city because it is dense and because it is an international gateway. This is a hypothesis that can now be tested with data.
We have tried to answer three related questions:
- Why did some cities encountered Coronavirus infections earlier than others?
- Why do some cities have more confirmed cases of Coronavirus infections than others?
- Why do some cities have more deaths from the Coronavirus than others?
In the following sections we analyze Coronavirus data for 28 March 2020 to provide answers to each of these questions using multiple regression models. Before we can do that, we explain how we assembled the dataset for these models.
Please fill out the information below to receive our e-newsletter(s).
*Indicates required.