Related
The Economist
Press
/ Feb 27,2016
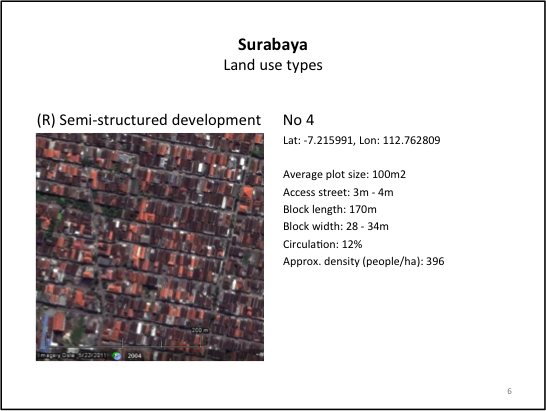
Slowly does it
Traffic in the Philippines' capital
Jun 16,2014
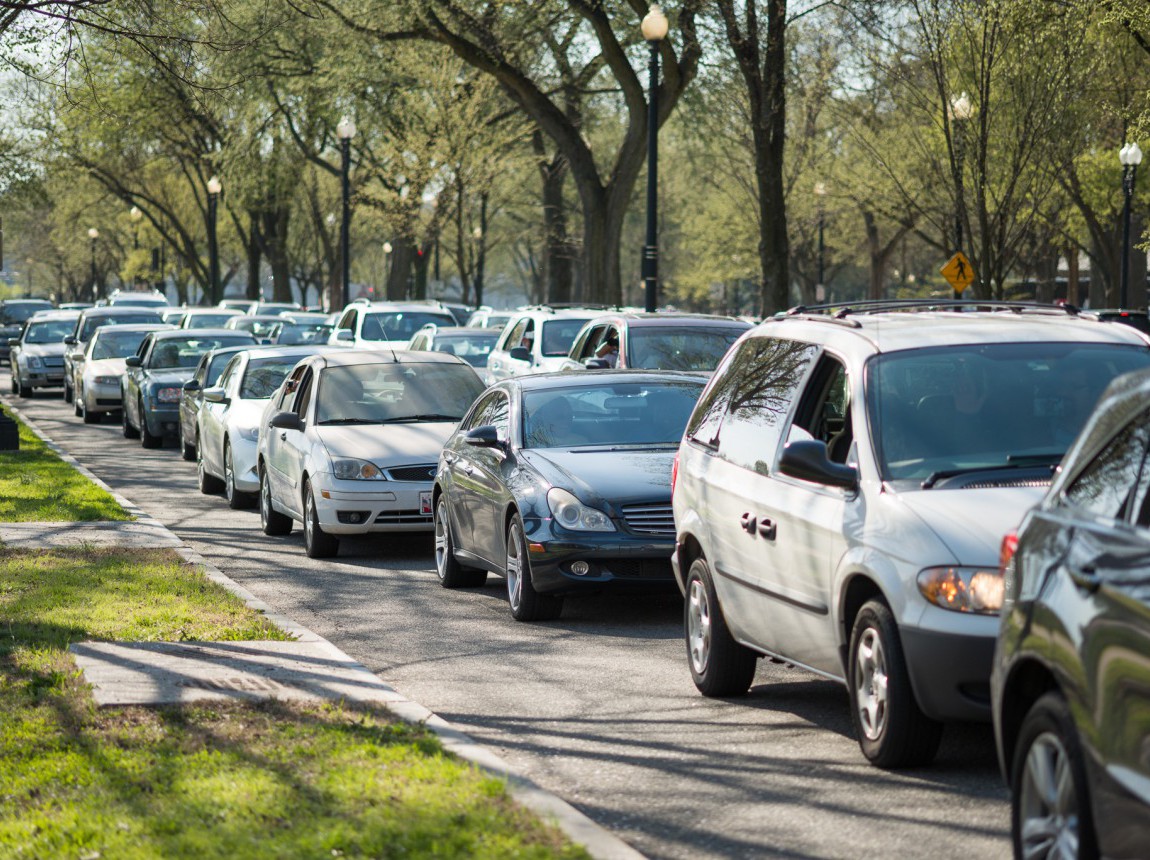
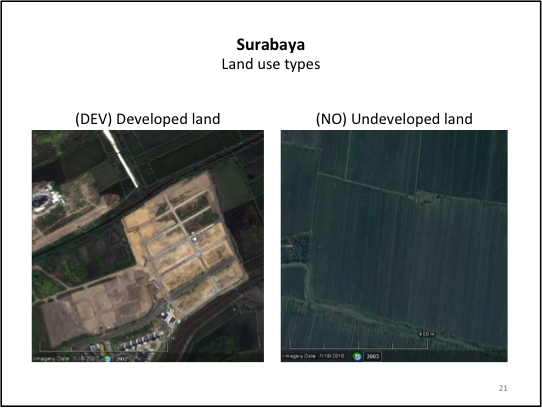
Over the past few decades, Alain and Marie-Agnes Bertaud have worked in many different cities around the world. During that time, they have developed a method for learning about a city when they begin working there and for updating their views as the city changes. When making urban policy, we necessarily do it at a very high level across the city, but the Bertauds say this can be very dangerous if you do not understand the smaller, micro story. Much of their initial examination of a city is geared toward adding anecdotal, micro information to the macro story. The images attached are from a presentation that Marie-Agnes created to guide their exploration of Surabaya, Indonesia.
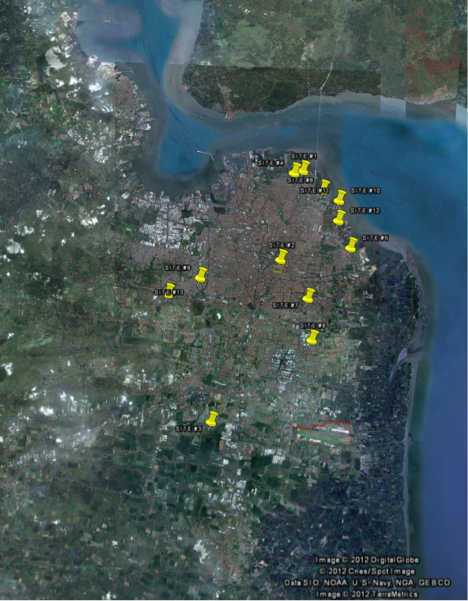
Before they go to a new city, Alain and Marie-Agnes use Google Earth to locate, map, and gather basic information about the neighborhoods they want to explore. When choosing which neighborhoods to explore, they always include the central business district and look for a diverse set of neighborhoods in terms of income and wealth as well as housing typology. They print off maps for these neighborhoods, and they spend the first day just traveling to those neighborhoods. They look at types of housing, and, if possible, they look inside housing units to get a sense of size and amenities. They also spend some time walking randomly in the city, and they often try to walk across part of it to get a sense of a cross-section of the city. In general, Alain and Marie-Agnes say they take minor precautions for their personal safety, such as not carrying a large camera, but safety hasn't been a major issue. Alain did recall one taxi driver in Kabul who advised him not to stay in any one place for very long!
Alain and Marie-Agnes also gather the income distribution curve for the city (it's even better if that information is available on the individual neighborhood level, but that is less common). When the income distribution curve is not available, they benchmark income by the salaries of various unskilled and skilled labor positions. They then compare that data to the available housing market, to see what kinds of housing people can afford, typically assuming that 30% of income will be spent on housing. There will, of course, be variations in the price of housing based on location, but this will generally be fairly narrow. They also try to locate the cheapest formal housing in order to see its quality and amenities.
Alain also suggests taking all forms of transportation, including subways, buses, and rickshaws. In particular, he looks at the kind of real estate that exists around the ends of the train lines in order to see how dense the area is. He also times the trip from point to point because this data is frequently not available. He also looks at road use, including the types of vehicles used and the density of traffic.
Alain and Marie-Agnes also talk to people in different socioeconomic subsets when it’s culturally acceptable to do so. When Alain was at the World Bank, he would frequently ask to go to the offices of lower level workers, rather than have them come to the minister’s office. Traffic engineers, public transit schedulers and maintenance workers can provide very important perspective, he says, and it is helpful to talk to them in their offices where they will likely be most comfortable. When it’s culturally acceptable, he also likes to socialize with these workers after office hours to better understand their perspectives.
Alain and Marie-Agnes caution that all of this data is anecdotal, but the perspective that it provides can be essential to fully understanding a city and to creating good policy.
Tile image courtesy of Eduardo M.C.
Please fill out the information below to receive our e-newsletter(s).
*Indicates required.